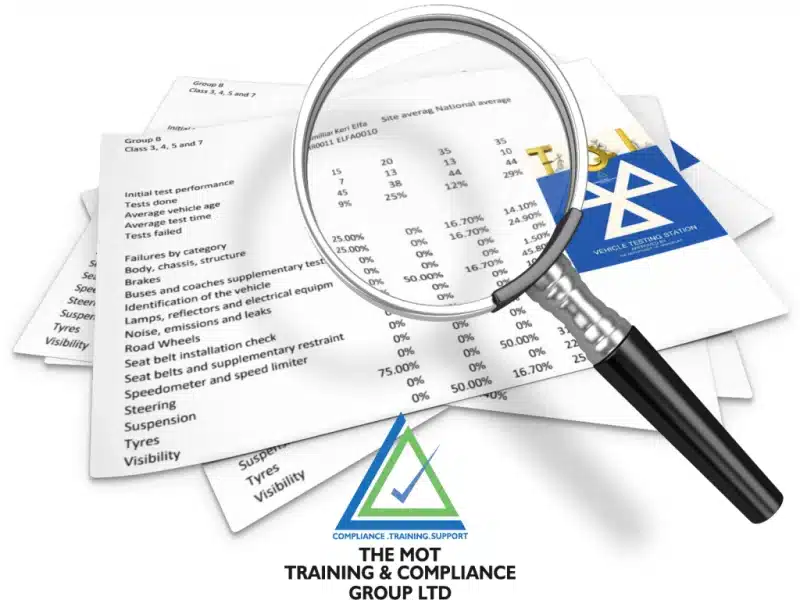
TQI is an abbreviation of the term Test Quality Information. The report is a compilation of the information needed to help you manage your MOT testers and centre effectively.
Every MOT centre and tester has the TQI report available to them on the DVSA site on every accessed via the MOT Testing Service and is updated monthly: providing a wealth of helpful information and enabling you to quickly and easily pick up any anomalies so you can take action and rectify them.
What information does a TQI report contain?
The Test Quality Information is used to measure the standards of MOT tests. For example, the number of tests completed by each tester at a site, the average vehicle age, the average test time and the percentage of tests failed (as shown in Fig 1).
| TESTER 1 | TESTER 2 | TESTER 3 | SITE AVERAGE | NATIONAL AVERAGE | |
| Initial test performance | |||||
| Tests done | 138 | 49 | 0 | 187 | 49 |
| Average vehicle age | 13 | 11 | 0 | 12 | 9 |
| Average test time | 46 | 39 | 0 | 44 | 43 |
| Tests failed | 28% | 61% | 0% | 36% | 30% |
| Failures by category | |||||
| Body, chassis, structure | 10.50% | 10.00% | 0% | 10.30% | 14.30% |
| Brakes | 18.40% | 20.00% | 0% | 19.10% | 25.80% |
| Buses and coaches supplementary tests | 0% | 0% | 0% | 0% | 0% |
| Identification of the vehicle | 0% | 0% | 0% | 0% | 1.30% |
| Lamps, reflectors and electrical equipment | 31.60% | 46.70% | 0% | 38.20% | 45.40% |
| Noise, emissions and leaks | 5.30% | 23.30% | 0% | 13.20% | 10.30% |
| Road Wheels | 5.30% | 6.70% | 0% | 5.90% | 1.00% |
| Seat belt installation check | 0% | 3.30% | 0% | 1.50% | 0% |
| Seat belts and supplementary restraint systems | 2.60% | 3.30% | 0% | 2.90% | 3.70% |
| Speedometer and speed limiter | 0% | 0% | 0% | 0% | 0% |
| Steering | 2.60% | 3.30% | 0% | 2.90% | 6.40% |
| Suspension | 23.70% | 33.30% | 0% | 27.90% | 31.50% |
| Tyres | 7.90% | 10.00% | 0% | 8.80% | 21.90% |
| Visibility | 15.80% | 20.00% | 0% | 17.60% | 21.50% |
What is TQI Analysis?
The DVSA website explains (we are paraphrasing) that MOT testers need to compare their personal performance against the national average: testers should note that there may be valid reasons as to why their personal performance may differ from the national average, for example, the average age of the vehicle tested. Comparison, where a difference is found, should lead the tester to question why the difference exists. For a more detailed explanation, please read our article, What’s involved in a monthly TQI Report.
Have you seen our post on Test Logs? When combined with TQI report analysis they can make your sites QC checks more robust and informative. If you have any questions on MOT Compliance, need some support or some MOT training, contact Karena by email or call 0800 1777 344

